Keep track of your Funnel analytics with reports
With a background in journalism and marketing, Heather is well versed in all things content and inbound marketing. She’s passionate about delivering content that helps her reader take action almost instantly.
It's been two years since we released our Reports functionality in Digistorm Funnel. This exciting feature was developed after taking on board feedback from a number of partner schools (and a lot of hard work behind the scenes)! Our clients wanted a way to view and analyse critical insights directly from Funnel, as well as create and share personalised dashboards with their teams.
Since then, the Reports module has become one of the most-accessed features within Funnel, breaking down complex lead information into easy-to-understand graphs and charts. It's loved by school leaders, administrators, admissions staff and more as it helps you to have complete transparency across your school's entire enrolments process.
In this post, we're going to have a look at some key reports that are available within Funnel, and how your school can act on the data displayed to make improvements to your process. Let's dive in!
1. Pipeline stage analysis
Your Funnel pipeline is built to match the unique stages of your school's enrolment process. Common stages include:
- Expression of interest — a prospective family has called, visited, inquired or emailed your school.
- Registration — they have registered to visit your school, either for an open day or tour.
- Application received — they have applied for enrolment at your school.
- Interview — your school has decided to interview the family.
- Closed won — they're in! You have a new student at your school.
- Closed lost — they're out. The family decided to enrol elsewhere.
With pipeline stage analysis, you can check your lead engagement and progression through each stage. This will help you to determine how well your school is managing admissions, and where your process could be letting you down.
2. Geographical data
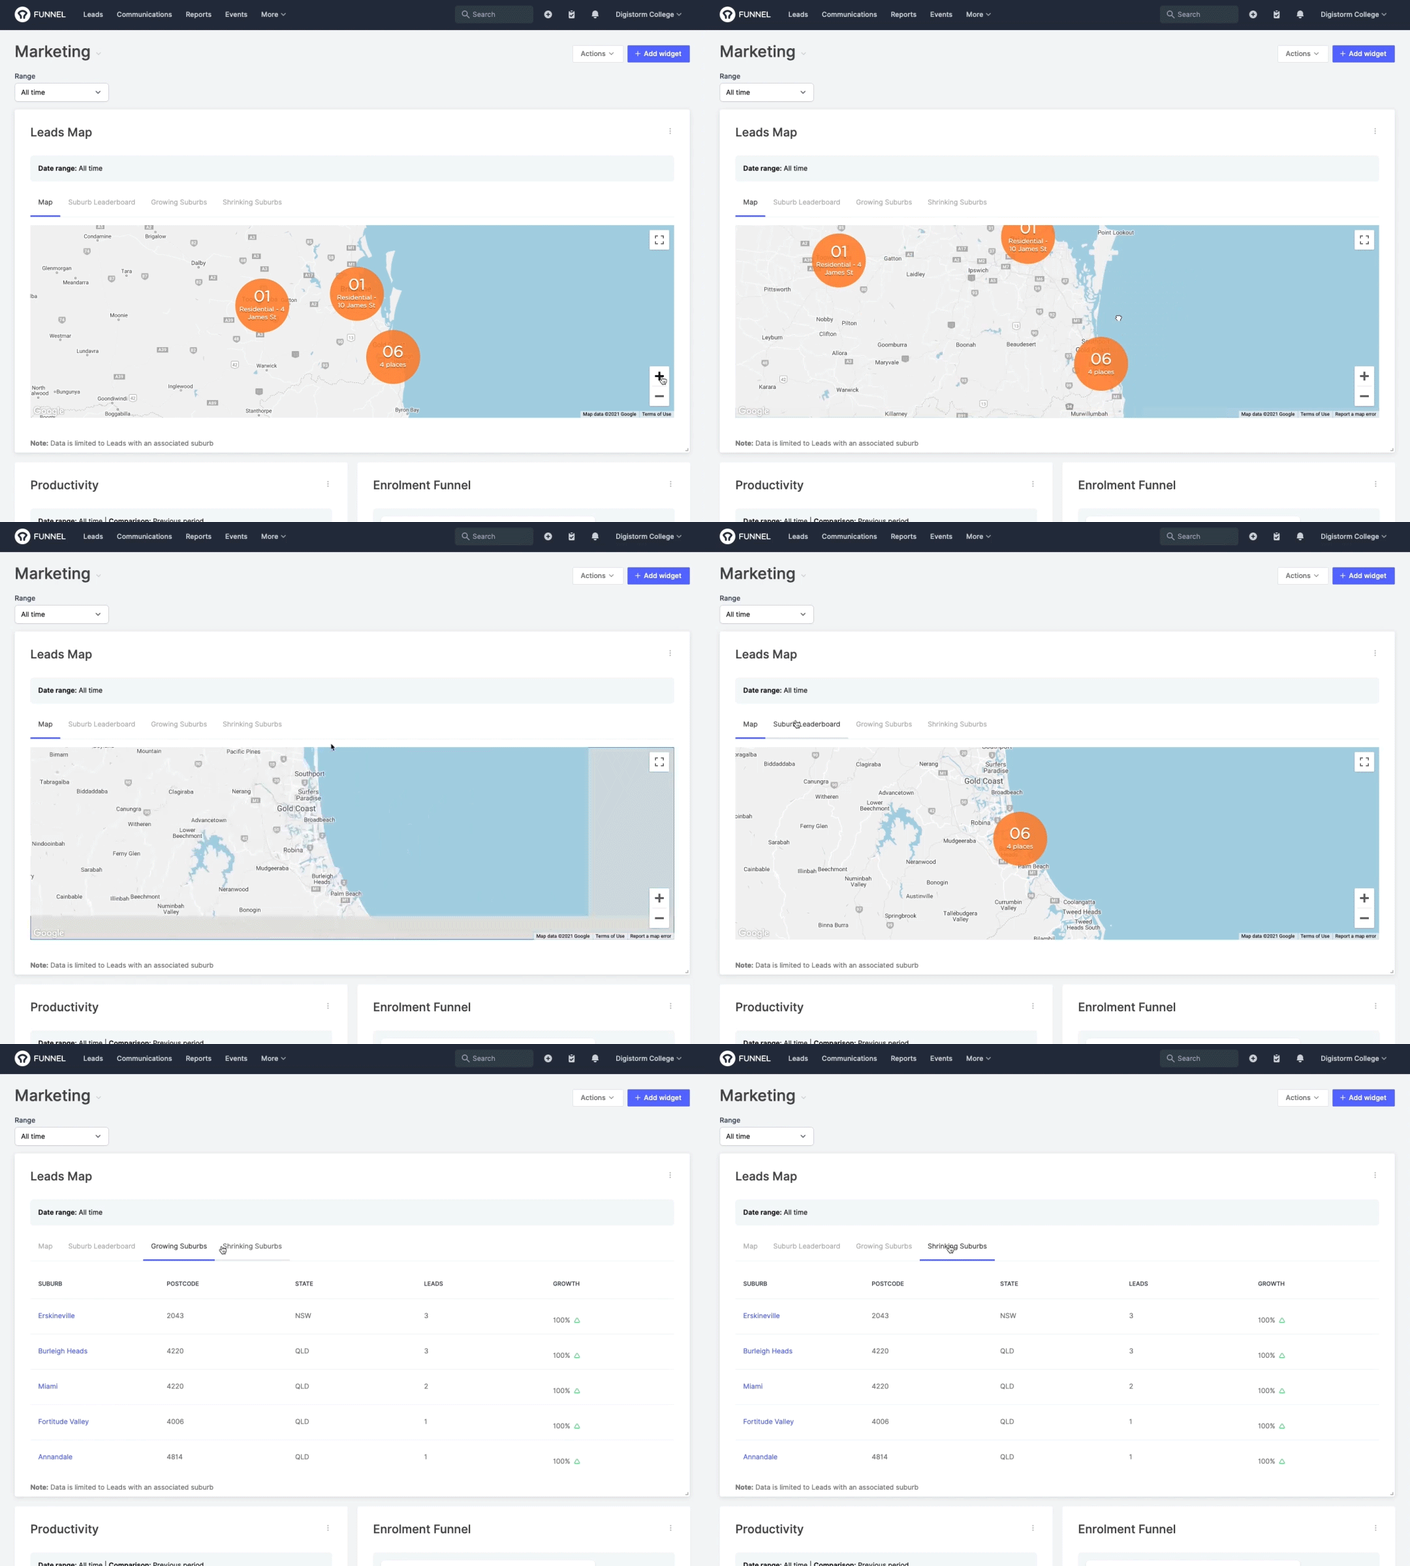
You can get an accurate geographic representation of where your leads reside using the map. This information can help you to make informed decisions about whether to pursue enrolment with a particular child if you are using Funnel's lead scoring functionality to speed up your admissions process.
It can also help you to understand where (geographically) the majority of your leads are living, and if there are certain target locations where you might need to amp up your marketing efforts.

3. Closed lost information
Using the Closed Lost graph, you can understand where your leads are being lost to see if there might be common reasons for why this is happening. For example, if you are finding a lot of leads are being marked lost in the 'Offer Sent' stage, you might want to revamp your letter of offer to ensure you're not falling down at the final hurdle.
Your Closed Lost report will also provide you with a number of reasons that parents have indicated why your offer wasn't accepted. You can collect this data by setting up an email in Funnel that simply asks parents why they didn't choose your school. Alternatively, if you are gathering this information over the phone, you can simply mark it as the Closed Lost reason manually.
4. Custom dashboards
Finally, one of the best features of reports is the ability to create and personalise your own dashboards, by showcasing the most relevant data to you or another member of your team. You can add all of the reports available within Funnel in the order that is useful to you. You can also include individual widgets that are most applicable to your role such as the 'My Tasks' area or the Activity Report.
You can easily then share your custom dashboards with different team members so they can quickly and easily see the most important information to them, straight away.
And that's all the information you need to know about Digistorm Funnel's reporting features!