If you are an administrator of a parent communication app at your school, you probably often wonder how many people are accessing it and how frequently. Most school apps provide very basic information about download data and installs, but there is a way to get much more information! Google Analytics — that's right, trusty old Google Analytics — can provide you with meaningful data about your user acquisition and engagement with your mobile app.
What can you learn from Google Analytics?
Google Analytics provides you with a series of reports where you can measure and optimise your app performance. You can view information about:
- The number of users who are accessing your app, including which device they're using and their demographics information
- What your users are doing once they're in your app
- A quick, live snapshot of user activity
Implementing Google Analytics in your school app
Google Developers provides extensive documentation that app developers can use to set up Google Analytics for your mobile app. Mobile developers can view that documentation here. If you're not a developer, you will need to reach out to your app development company and ask them to implement Google Analytics on your behalf. If you're a Digistorm customer, you can rest assured that your school app comes with Google Analytics already implemented!
To access your Google Analytics reports, you will need to:
- Create a Google account, or register your existing school email with Google
- Provide your app developer with your Google account email address and request access to your Google Analytics data
- Log in to Google Analytics on your desktop or mobile device
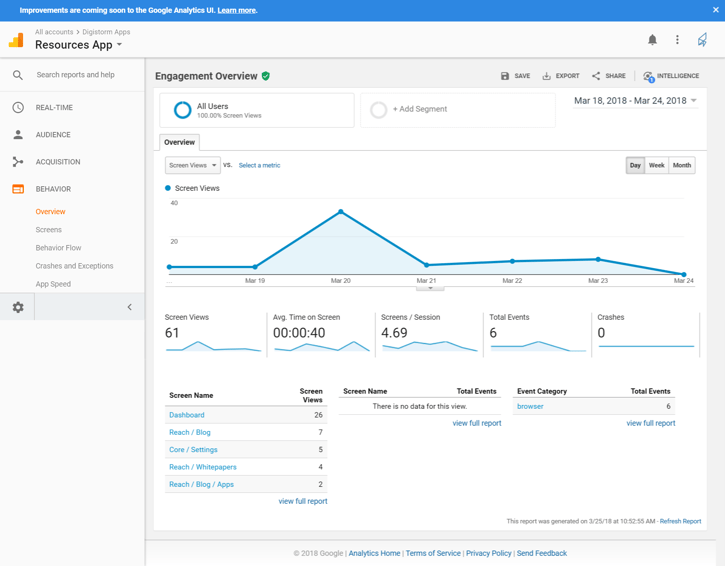
Understanding Google Analytics reports in your app
Once you've logged into your Google Analytics account, you can use the left hand side menu to navigate to the data you need. A great place to start is with the Overview reports to get a quick understanding of how frequently your app is being used. You can find the overall reports by navigating to either Audience, Acquisition or Behaviour and then clicking 'Overview'.
You can change the date range of the data you're looking at by clicking the dates in the top right.
Here are some other reports that could be beneficial to your school to help you improve the engagement and performance of your app.
Screen views report
This report is located under 'Screens' in the Behaviour section of the left hand menu. It allows you to see which sections of your app your users are most interested in. This report will also allow you to report on individual items such as notices, newsletters and calendar items. On days when you have sent a push notification, you may notice spikes in screen views.
Events reporting
This report is located under 'Events' in the Behaviour section of the left hand menu. It provides you with a breakdown of certain user actions within your app, including:
- Login requests
- Document downloads or opens
- Link clicks to any other external website — including links that load other apps or an external web browser
Audience reporting
This report is located under 'Overview' in the Audience tab section of the left hand menu. It provides you with a breakdown of your users' information, including which device they are using, their default language setting and demographic information, such as their location.
The Behaviour reports will also allow you to report on which percentage of your users are considered 'Active Users' and user loyalty.
Live Analytics
Similar to using website Analytics, integrating your app with Google Analytics will allow you to see how many users are interacting with your app in real time. This is helpful to monitor if you are launching an important push notification or making a change to your app.
Learn more about the ins and outs of school apps with our beginner's guide.
.png)